For each project, you can click on Show More for details about the technical process and my thoughts.
Boxd Office
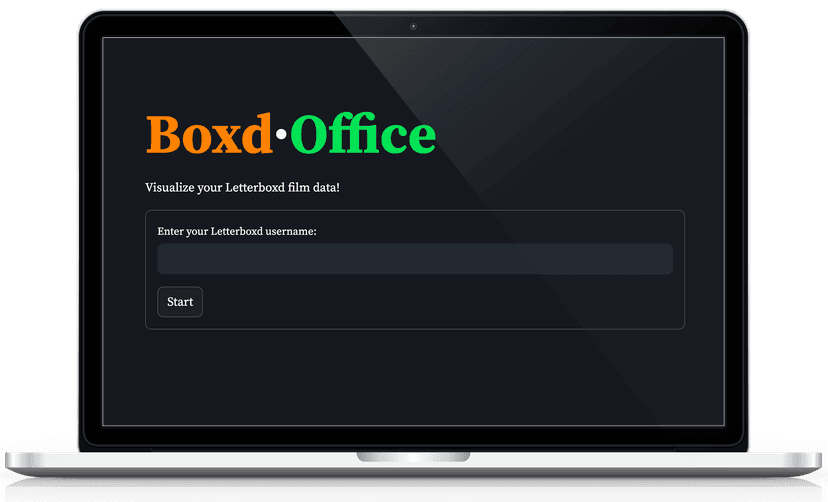
A web app that dissects and visualizes your movie watching
Boxd Office is a Letterboxd analytics dashboard that I built and deployed as a personal project! It scrapes a Letterboxd user’s public profile and provides insight into their preferences and patterns. This project was motivated by my passion for movies and interest in data science; I wanted to obtain and transform raw viewing data into meaningful, interactive charts.
The Project
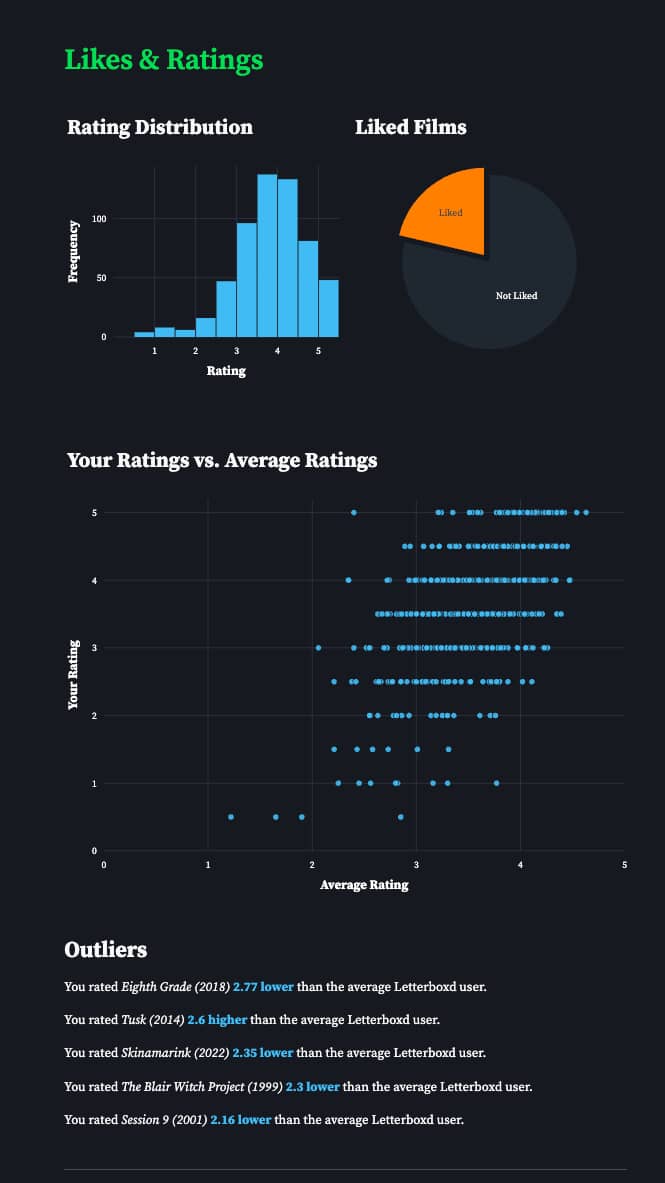
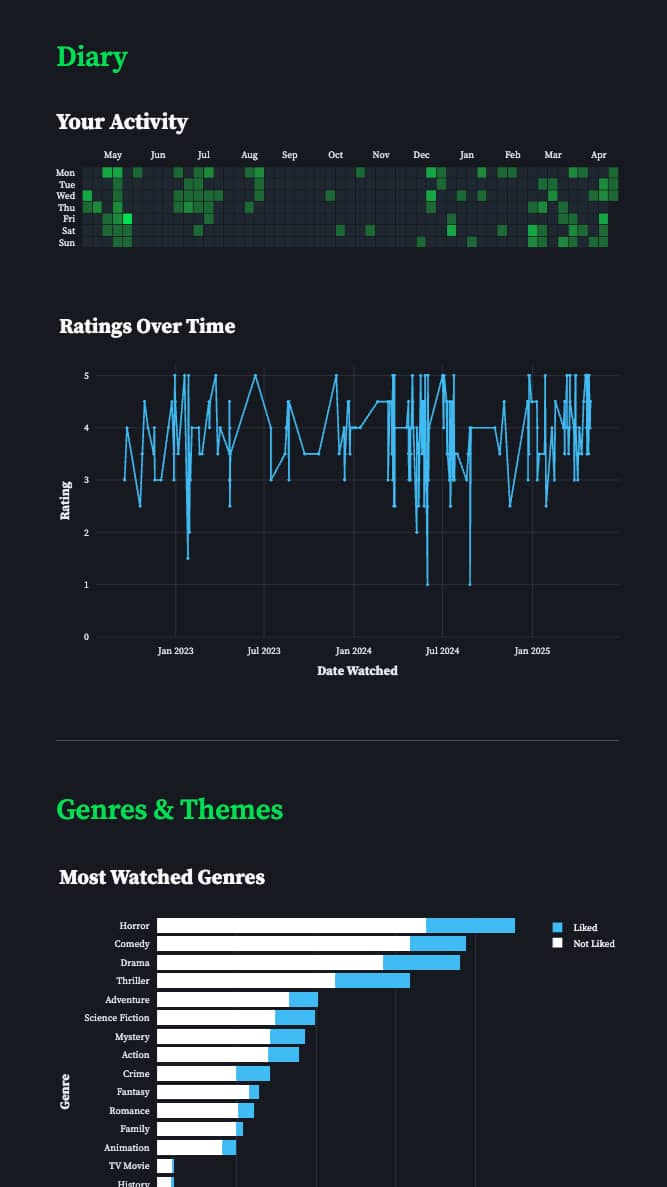
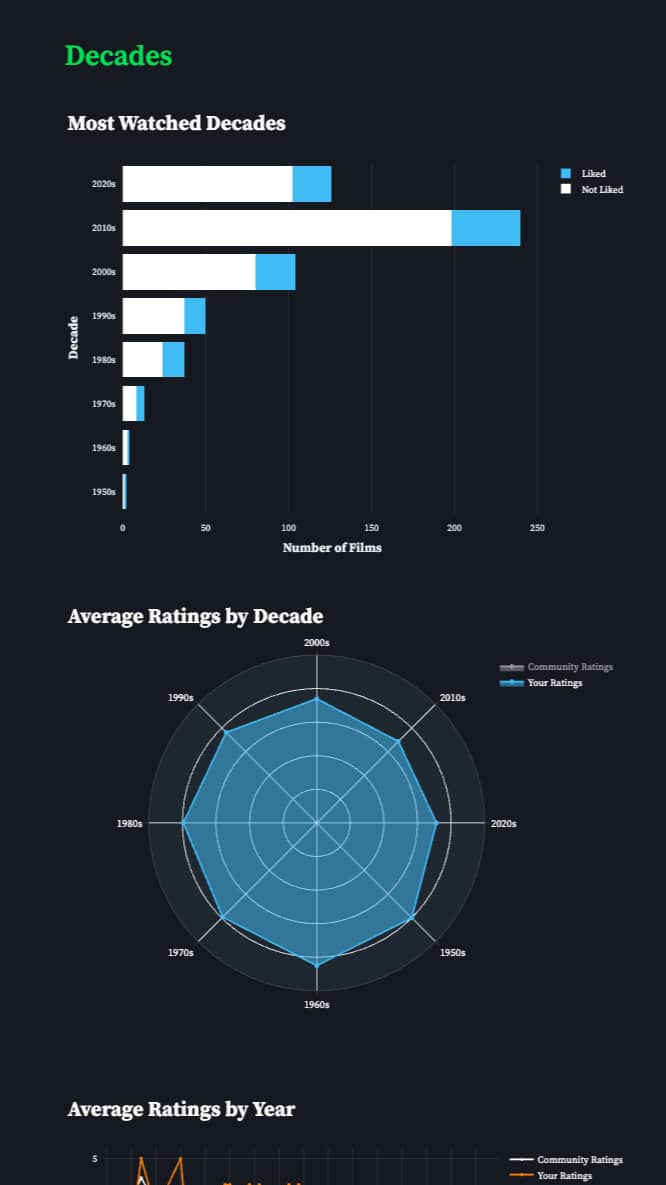
Here's what you'll see after your profile has been scraped:
Technical Overview
- Python with Beautiful Soup for web scraping profiles and film data
- Multithreaded scraping with ThreadPoolExecutor for faster data collection
- Pandas for data processing and analysis
- Plotly for interactive visualizations
- Streamlit for designing and deploying the web interface
Thoughts
This project was a really fun way to combine my personal interests into a tangible product. I thought about what kind of insights would be meaningful to someone who watches a lot of movies and how to present those insights in a way that's both informative and enjoyable to look at. Letterboxd doesn't have a public API, so I turned to web scraping with Beautiful Soup. This meant I had to be careful with rate limits (I accidentally exceeded them at one point). On the front-end side, I put some effort into mimicking Letterboxd's UI to make the dashboard feel like a natural extension of the platform. There's a lot of room to improve and expand the project (ML-based recommendations?), but overall I'm happy with how it turned out, and it was super satisfying to bring the idea to life.

Personal Website
What you're looking at right now!
This website is like a central hub for my professional history, passion projects, and personal interests. It was designed with both aesthetics and functionality in mind, and I wanted to make it as personal as possible. Thanks for checking it out!
Technical Overview
- Next.js for building the front end
- Tailwind CSS for styling
- Vercel for deployment
- A couple of APIs & services:
- Letterboxd RSS feed for recently watched movie data
- Last.fm API for Spotify listening data
- Deezer API for music artist images
- Nodemailer for emailing recommendations
Thoughts
I was initially unsure about whether I should make this website strictly professional or a little more casual. Ultimately, I leaned into the latter because I wanted it to be like a snapshot of the person I am right now.
I built this website from scratch and I'm a bit of a perfectionist, so it ended up becoming a never-ending cycle of tweaks and refinements. I became very fixated on tiny design choices; as a result, I spent an embarrassing amount of time browsing fonts, adjusting hex codes, and trying out different hover animations. Still, it was fun and it felt very rewarding to create something that grows alongside my interests. I'll try to keep this website as up to date as possible.

Poképlants
A game to make people feel more guilty about neglecting their houseplants (1st place @ Hack the 6ix)
Poképlants was built at Hack the 6ix, where our team of 4 wanted to tackle the issue of houseplants dying from lack of care. We wanted to make a product that would make plant care more fun, engaging, and rewarding, so we turned it into a Pokémon-inspired game. This project combines hardware sensors, computer vision, and Pokémon-style web-based RPG to monitor plants in real-time and gamify plant care.
The Project
Poképlants creates an interactive gaming experience where users can use their real-life houseplants as Pokémon-style characters to battle others. The user would add their plant to their "Plantdex", and hardware components (a camera, moisture sensors, and a photoresistor) would provide real-time insight into the plant's health. Stronger plants have stronger abilities, so the game is meant to create an incentive for players to take better care of their plants.
Technical Overview
- Hardware for measuring plant health
- OpenAI for identifying plants and their health
- Langchain for processing data into game actions
- Flask for the back end
- Socket.IO for real-time multiplayer battles
- React for designing the game
Thoughts
This project initially started off as a kind of unserious idea from a team member ("what if we made Pokémon but with actual plants?"), but it ended up taking us further than we expected. Our intention was to go for the environmental track prize, which was an IKEA shark plushie. Instead, we ended up winning the whole thing and receiving a pair of 2nd-gen Airpod Pros! I found it pretty exciting to collaborate with a talented team and work under pressure to turn an idea into a product. There was a lot of front-end work involved here, and we were determined to make the game and its mechanics look fun, which is why we decided to try to evoke the nostalgia of old Pokémon games. Overall, I was happy about how this project turned out and pleasantly surprised by its win at Toronto's largest summer hackathon.

Hydropower Inflow Forecasting
A machine learning model to optimize hydropower plants
During my recent co-op term at Hatch, I used Pandas and Tensorflow to build a custom LSTM model to predict water inflow, which is one of the most unpredictable variables in hydropower. By processing large datasets of time-based hydrology data, this model helps optimize reservoir management by minimizing head losses. In the end, the model was able to achieve an r² score of 0.91, indicating high accuracy compared to baseline methods.
Technical Overview
Building the time-series forecasting model involved:
- Scraping and processing 23 years of NASA OPeNDAP hydrology data (2002 - 2024), which included environmental metrics such as rainfall, snowmelt, soil conditions, and much more
- Lots of feature engineering to align the different environmental metrics with their delayed impact on water inflow
- Designing a 3-layer LSTM network with a custom Huber loss function to handle outliers
- Fine-tuning dropout, regularization parameters, and model architecture to prevent overfitting
- Visualizing evaluation metrics (validation loss tracking, dropout, r²)
Thoughts
Hydropower and renewable energy was a field that I had pretty much no knowledge in before working at Hatch, so I was eager to learn about the role of software in the energy sector. This project was interesting to work on because of the real-world application and potential for growth. What excited me the most was seeing how this model could be improved and integrated into the company's optimization systems for hydropower plants. As for the development process, I ended up gaining a much deeper understanding of the theory behind machine learning while I was experimenting with the model. It took a lot of time and learning, but I enjoyed the process!

Nudge
An AI-powered Chrome extension that knows when you're slacking and pressures you to get back on track
Nudge was built at UofT Hacks, where our team of 4 wanted to tackle productivity and procrastination in a way that felt more human than typical productivity apps. We built a Chrome extension that observes your browser activity and responds with sarcastic commentary inspired by the game The Stanley Parable.
The Project
The user would express the task that they are trying to accomplish; for example, maybe they want to practice Leetcode and get a job. The extension would then start observing their activity, making snarky comments verbally and nudging them to get back on track (hence the name). If they opened a problem and went straight to the solution, they would get called out. The extension "speaks" out loud in a tone and voice that's meant to mimic the narrator in The Stanley Parable.
Technical Overview
- JavaScript for the core functionality and user activity monitoring
- React for the extension's pop-up and dashboard
- MongoDB for storing activity logs
- Flask for the back end
- GPT-4 (OpenAI) for generating responses
- Eleven Labs TTS for giving voice to the narrator
Thoughts
This product isn't perfect (most hackathon projects aren't), but it taught me a lot about how Chrome extensions work under the hood. I gained some pretty valuable full-stack experience, but unfortunately also learned firsthand about how frustrating Chrome extensions can be to debug, especially when I'm trying to trace different messages and errors between background scripts, popups, and content scripts. However, this made it extra satisfying when the project started coming together nicely. I enjoyed the process of building Nudge, especially in the unique environment of a hackathon, and found the premise to be really fun to design.

Chroma: Your Personal Colour Assistant
A mobile app to simplify the colour mixing process
Chroma was built for an online hackathon, where me and my teammate wanted to build a tool that takes the guesswork out of colour matching by generating palettes and determining ratios mathematically. This project was motivated by our shared enthusiasm for art.
The Project
Chroma allows the user to input their available colours by adding them with a colour picker or uploading a photo of their paint swatches. These colours will be stored in a palette that they can edit and fine-tune. Next, the user can choose to take or upload an image to use as a reference, and the app will generate a palette based on this image. With these two palettes, the app uses a linear algebra approach to calculate the ratios for how much of each available colour is needed to create the target colours.
Technical Overview
- Flutter for building the mobile app
- Flask for the back end, which includes a Python script to handle calculations
- OpenCV for extracting colours from images
- An AWS EC2 instance for hosting the Flask server
Thoughts
Mobile app development operates pretty differently from web development, so it was a little intimidating at first, especially since this was my first hackathon. However, we were determined to make it work, even under the time constraints. We did a lot of breaking, fixing, learning, and desperate researching to finish the project just in time. It's worth noting that the RGB colour model (which is optimized for screens) might not be the best representation of how paints actually mix in real life, but the resulting colours generally ended up being pretty close to the target colours. This experience introduced me to the world of mobile development, which I would definitely be willing to explore further.

Biquadris
A multiplayer Tetris clone
Biquadris was developed as the final project for a Waterloo course called CS 246 (Object-Oriented Software Development). The game supports multiplayer competition, multiple difficulty levels, and Tetris mechanics like block holding, ghost pieces, and upcoming block previews. Built as a collaborative project, Biquadris emphasizes clean architecture, design patterns, and resilience to change, making it easy to extend with new blocks, levels, or gameplay effects.
The Project
Some features of the project include:
- Multiplayer mechanics (compete 1v1 with another player)
- Tetris mechanics (e.g hold queue, block previews, ghost piece visualization)
- Customizable commands (the ability to rename commands and create macros)
- Level system (5 distinct levels with unique block generation rules)
- Special effects ("blind" and "heavy" modifiers to disrupt opponents)
Technical Overview
- C++ with smart pointers for automatic memory management
- Object-oriented design (e.g abstract Block and Level hierarchies)
- Observer design pattern for decoupled UI rendering (text and graphical displays via X11)
- Factory design pattern for dynamic block/level generation
- Modular components (separated game logic, UI, and gameplay mechanics)
Thoughts
The process of developing Biquadris was a deep dive into object-oriented programming. Before writing a single line of code, our team invested significant time in designing a detailed UML diagram to map out class relationships, responsibilities, and interactions. This upfront planning paid off; by agreeing on architecture early, we avoided major refactoring headaches later and could work in parallel without stepping on each other’s toes. We spent a lot of time thinking about good design, so this project also reinforced the benefits of encapsulation and loose coupling for making teamwork smoother. After implementing the core game mechanics, I had the opportunity to enhance the project with bonus features. I grew up playing Tetris, so I had a lot of fun with refining the design of the game and adding features. We ended up earning a 106% final grade on the project, which I was pretty happy about! The experience not only strengthened my skills with C++ but also deepened my appreciation for clean, scalable design.